Smart Money Concepts IndicatorBEST ICT AND SMC INDICATOR
The **Smart Money Concepts Indicator** is designed to enhance trading decisions by incorporating key principles from Smart Money Concepts (SMC), focusing on the detection of market structure changes, liquidity zones, order flow, and order blocks. This indicator is particularly useful for traders looking to understand market dynamics and make informed trading decisions based on advanced market analysis.
#### Key Features:
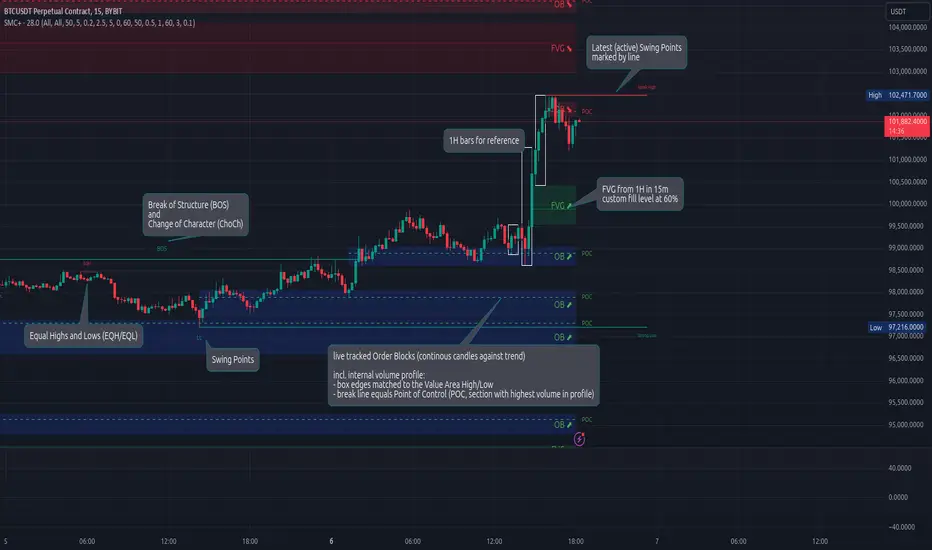
1. **Break of Structure (BOS)**:
- Identifies upward and downward breaks in market structure, indicating potential trend reversals.
- Visual markers on the chart help traders spot these critical levels.
2. **Change of Character (CHOCH)**:
- Detects significant changes in market direction, highlighting potential shifts in momentum.
- Clearly labeled signals indicate when the market may be changing its character.
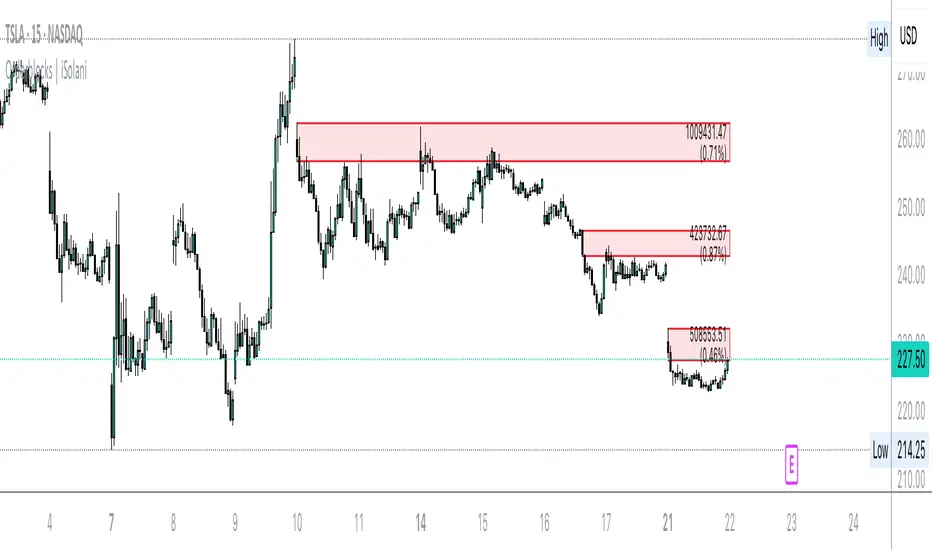
3. **Order Blocks**:
- Highlights order blocks, which are key areas where significant buying or selling has occurred.
- Provides visual cues for potential support and resistance zones.
4. **Liquidity Zones**:
- Marks liquidity zones, indicating areas where buy-side or sell-side liquidity may be targeted.
- Helps traders understand where the market might draw liquidity.
5. **Dynamic Take Profit and Stop Loss Levels**:
- Calculates and plots take profit (TP) and stop loss (SL) levels based on the Average True Range (ATR) for adaptive risk management.
- Customizable multipliers allow traders to adjust levels based on their risk tolerance.
6. **Order Flow Analysis**:
- Displays bullish and bearish order flow signals based on candle close relative to open.
- Provides insights into market sentiment and potential future price action.
#### How to Use:
- **Identifying Entry and Exit Points**: Use BOS and CHOCH signals to find potential entry points, while leveraging TP and SL levels for risk management.
- **Market Analysis**: Analyze order blocks and liquidity zones to make informed decisions on market behavior.
- **Visual Confirmation**: The clear visual cues provided by the indicator make it easier to interpret market movements and align trades with institutional behavior.
#### Conclusion:
The Smart Money Concepts Indicator is an invaluable tool for traders looking to enhance their understanding of market structure and make more informed trading decisions. By integrating advanced concepts like BOS, CHOCH, and liquidity analysis, this indicator helps traders navigate the complexities of the market with greater confidence.
Pine Script® indicator